
Portfolio Analytics Lab
Your investments, your PAL.
Connect Trading212, add holdings and activity from other brokers, and explore performance, income, allocation, forecasts and tax-prep views in one transparent workspace.
Start with synthetic demo data inside the hosted app.
Features
Built for flexible portfolio tracking, transparent calculations and practical personal analysis.
Overview & performance
Track value, PnL, FX impact, concentration, cash flows and estimated performance against a benchmark.
Portfolio & allocation
Explore holdings, activity and decision-quality views by broker, asset type, sector and your own groups.
Dividends & calendar
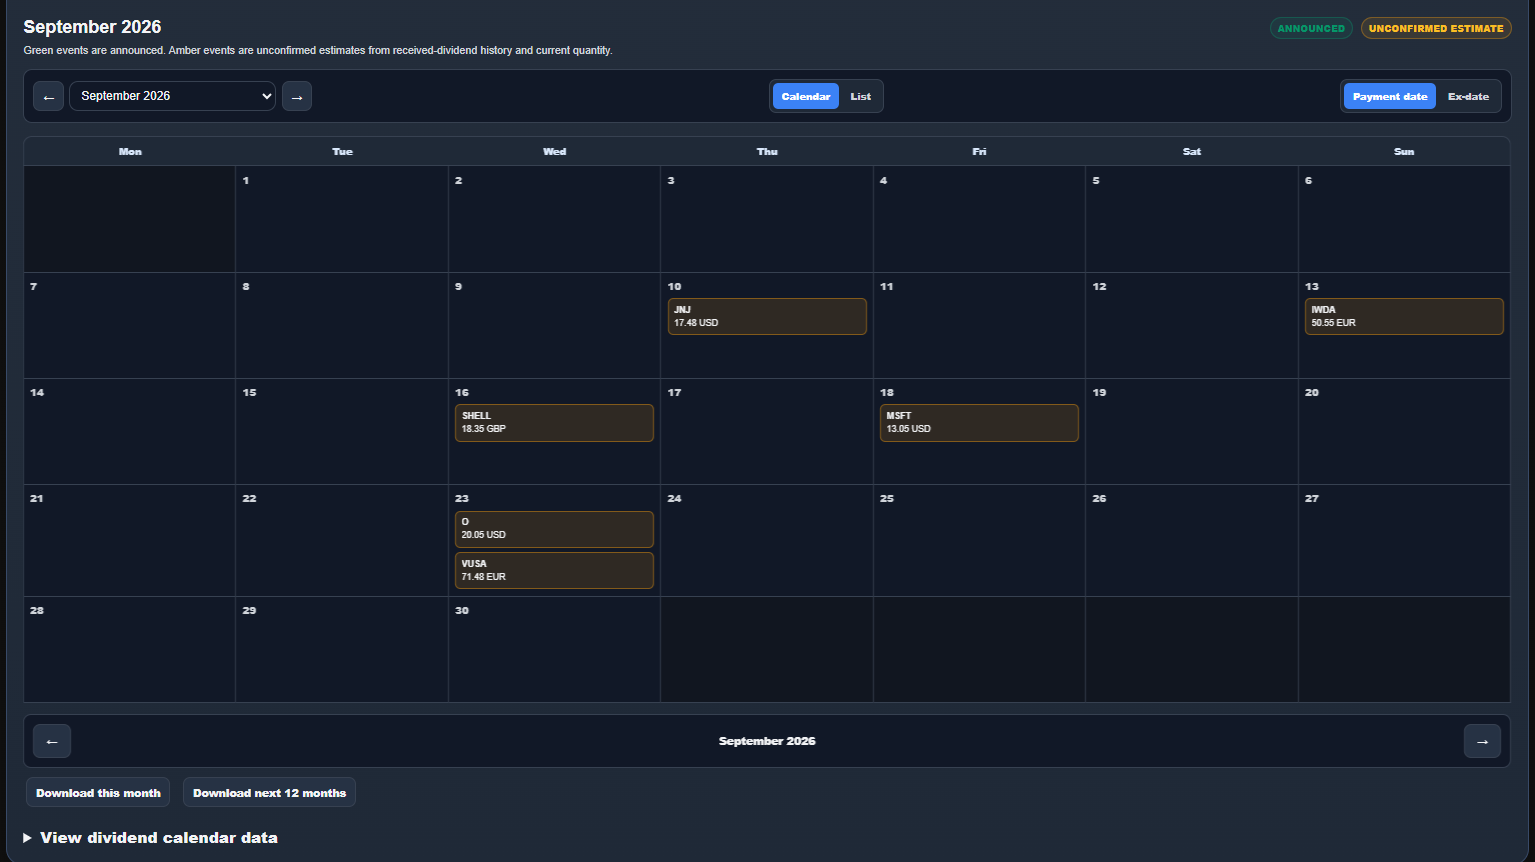
Review received income and a next-12-month calendar that separates announcements from estimates.
Forecasting
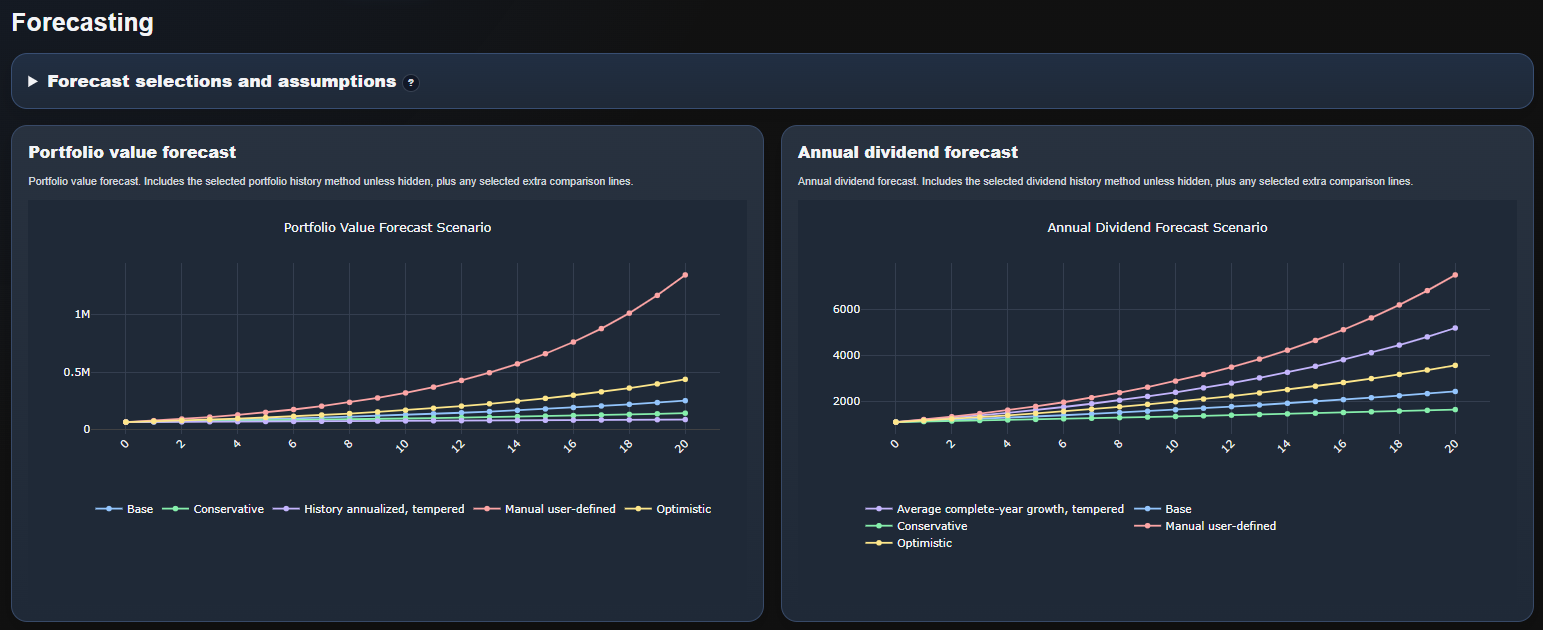
Compare transparent portfolio-value and dividend scenarios using saved, adjustable assumptions.
Imports & Asset Library
Add other brokers manually, validate rows and maintain asset identities and user-owned classifications.
Tax prep & reporting
Organize tax-relevant data, surface missing information and build focused reports for review.
Detailed capabilities
A closer look at the portfolio views and tools available in the app.
Bring your portfolio together
- Connect a read-only Trading212 account and refresh portfolio data
- Manual portfolio data can be added for other brokers and crypto accounts
- Review and validate imported rows before applying changes
- Use full-history or faster current-year updates when appropriate
- Explore the app first with synthetic demo data
Hosted web account
- Private web account with a saved dashboard, backups and preferences
- Read-only Trading212 credentials are encrypted when saved
- User-controlled entries for brokers and assets outside the direct connection
- Restore saved data or delete portfolio data and the account
- Keep display choices and reusable analysis settings across sessions
Portfolio overview
- Portfolio value, price PnL, FX impact and total PnL summary cards
- Dividend total and trailing dividend yield metrics
- Largest position and top-five concentration views
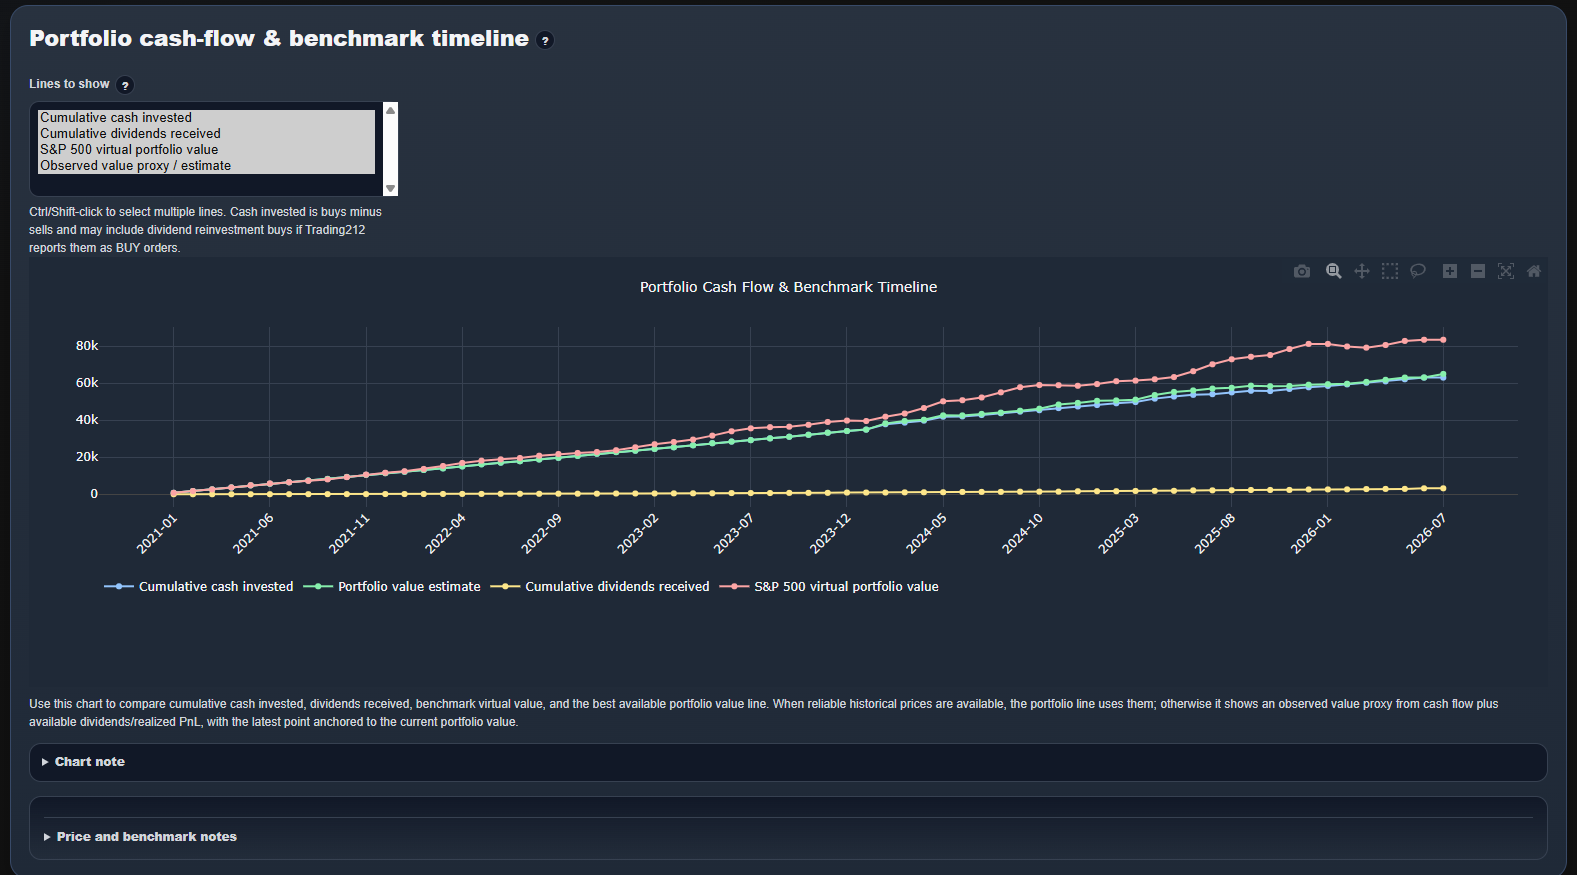
- Cash-flow and benchmark timeline with transparent calculation notes
- Estimated linked portfolio return versus a selected benchmark
- Clear visibility into how recent and complete the supporting market data is
Portfolio & allocation
- Holdings and PnL views with symbol, asset type, sector and broker filters
- Current value, price PnL, FX impact and total PnL charts
- Allocation by asset type and sector with optional user-saved targets
- Activity and experimental decision-quality views from available history
- Focused, sortable tables with user-selectable visible columns
Dividend history & calendar
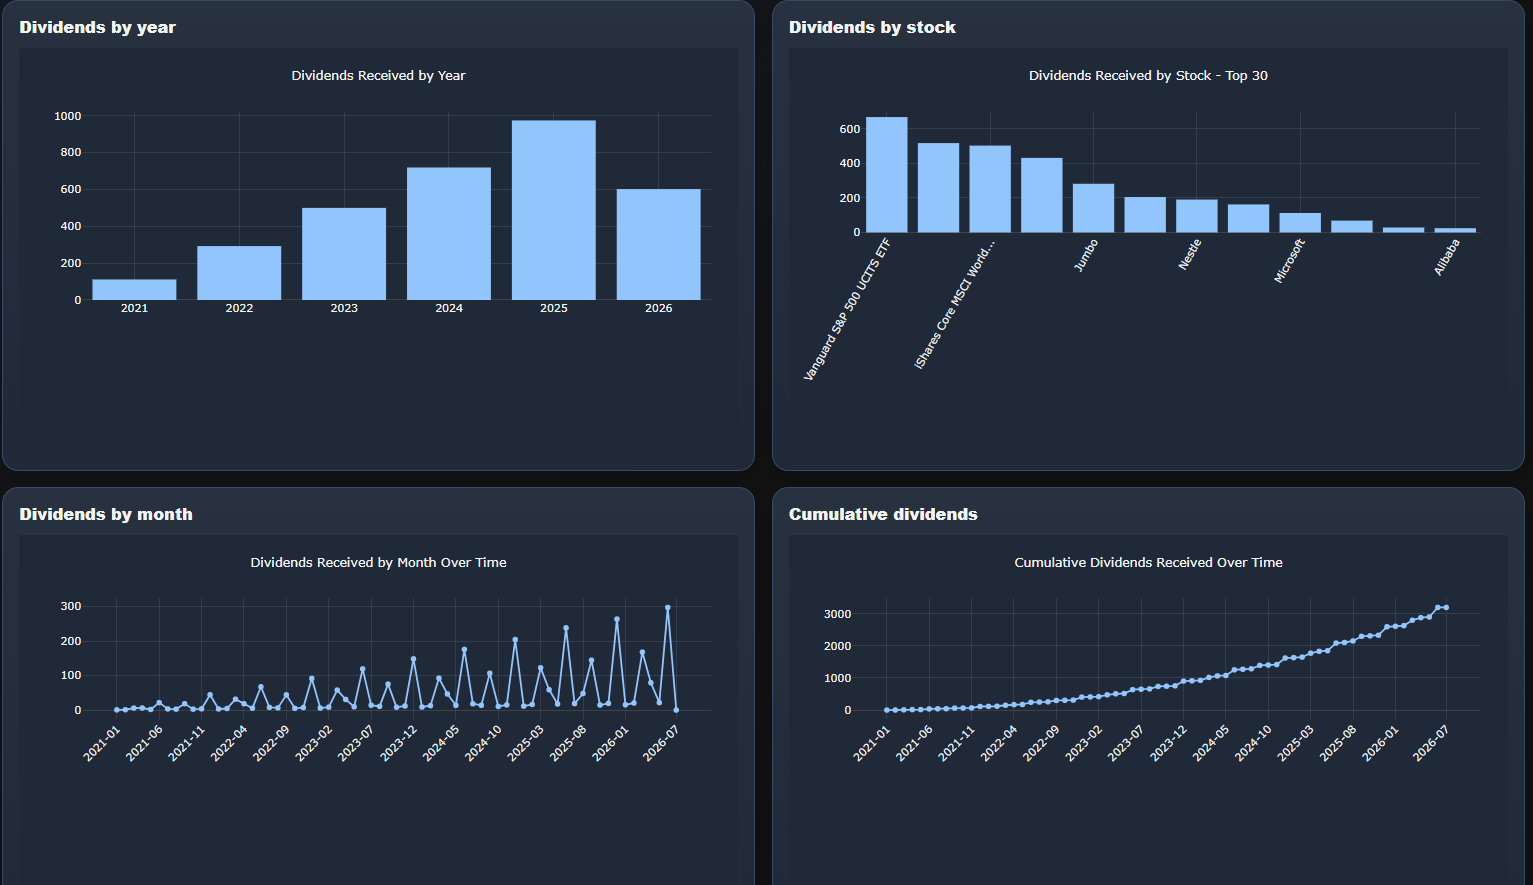
- Dividends received by year and by stock
- Monthly dividend timeline and cumulative dividend chart
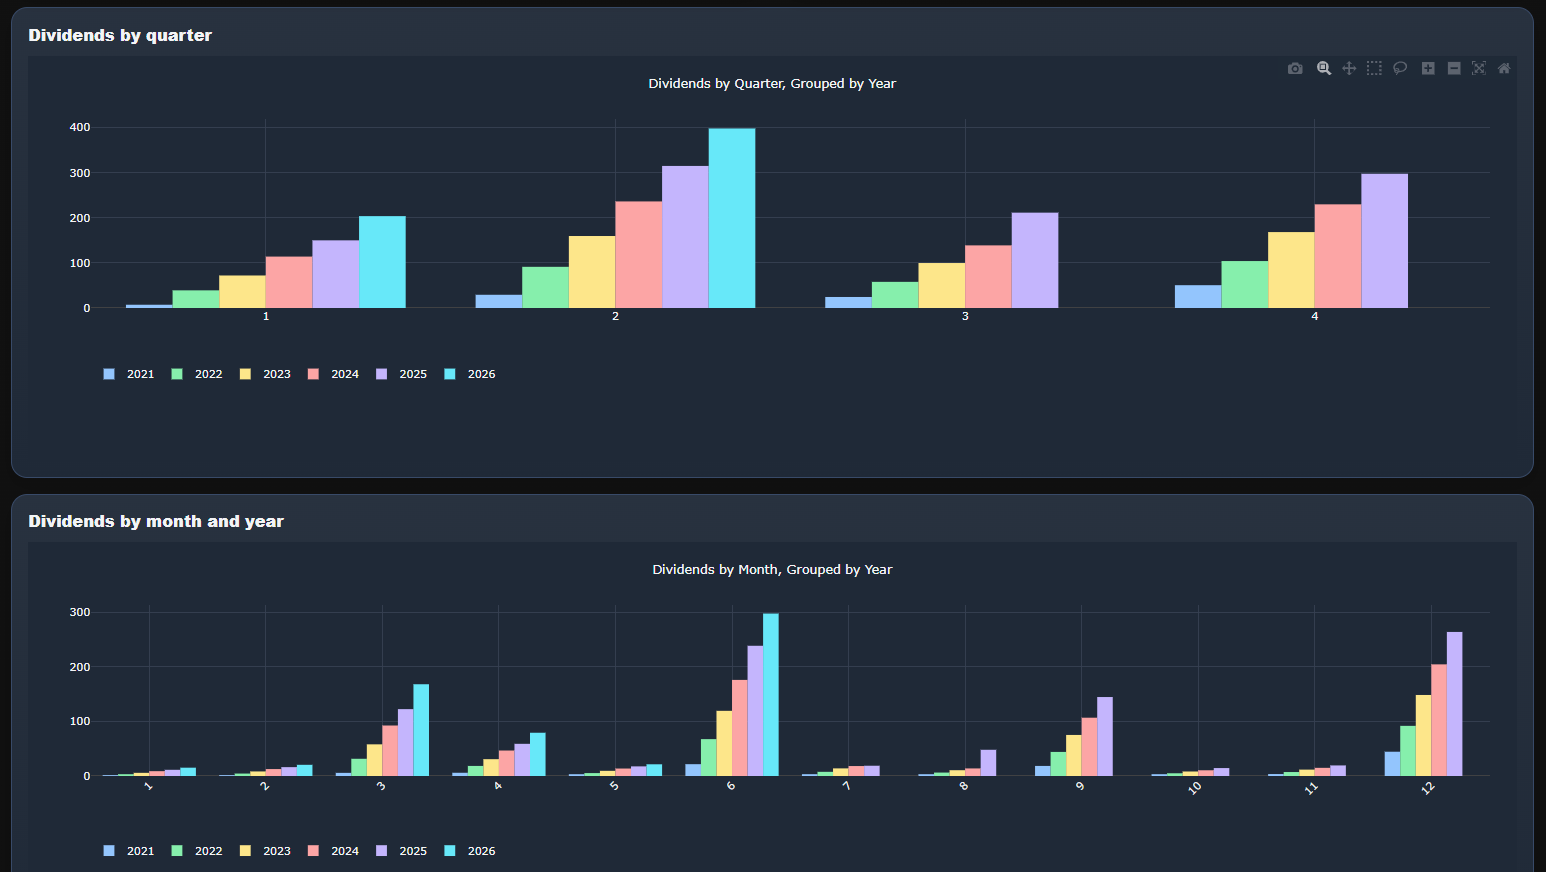
- Dividend seasonality by quarter and month, grouped by year
- Next-12-month calendar separating announced events from unconfirmed estimates
- Payment-date and ex-dividend-date views, monthly totals and focused downloads
Transparent calculations
- Calculation notes explain inputs, assumptions and data limitations near each result
- Historical views use available transaction, market-price and currency history
- Current holdings reflect the latest available market data
- Missing FX or incomplete source data is surfaced rather than silently treated as exact
- Estimates and confirmed values are clearly distinguished
Forecasting & benchmarking
- Scenario-based forecasting, not prediction
- Base, conservative, optimistic, historical and manual scenarios
- Saved assumptions for return, dividend growth and annual contribution
- Automatic S&P 500 benchmark plus custom benchmark presets
- Cash-flow-aware comparison against a virtual benchmark portfolio
Imports & manual data
- Manual transactions table for buys, sells, dividends, deposits, withdrawals, fees, taxes and FX adjustments
- Manual positions table for holdings from other brokers
- Column detection, mapped-row preview and validation before import
- Duplicate-import safeguards and clear missing-date, symbol, amount or FX warnings
- Manual-only portfolios work without a Trading212 connection
Tax Prep Hub
- Tax-year summary cards for dividends, withholding tax, realized activity and review-required items
- Tax readiness checks for missing dates, symbols, currencies, FX rates and incomplete sell/realized-PnL data
- Accountant-ready summary, questions for accountant and copyable LLM prompt generator
- Global-first treatment labels such as potentially taxable, potentially exempt, review required and informational only
- Single Excel Tax Prep Workbook export for review and preparation
Asset Library
- Asset matching reduces ambiguity where different investments share similar symbols
- True ticker, display name, asset type, sector, industry and country enrichment
- Your labels and classifications remain separate from suggested asset details
- Needs-review view for ambiguous identities or incomplete metadata
- Custom portfolio groups maintained beside the assets they organize
Self-service analytics
- Create and save up to three charts from dashboard tables
- Choose dataset, X axis, Y axis and optional split/group field
- Bar, line and scatter chart support
- Filter values and limit rows before plotting
- Save and reload reusable builder setups for the signed-in account
Report Builder
- Build a focused report from selected KPIs, charts and tables
- Add report notes and choose only the sections relevant to the review
- Generate a printable report with captured chart images
- Download relevant CSV data beside the source views when needed
- Tax Prep Hub provides a separate accountant-oriented workbook
Display & usability
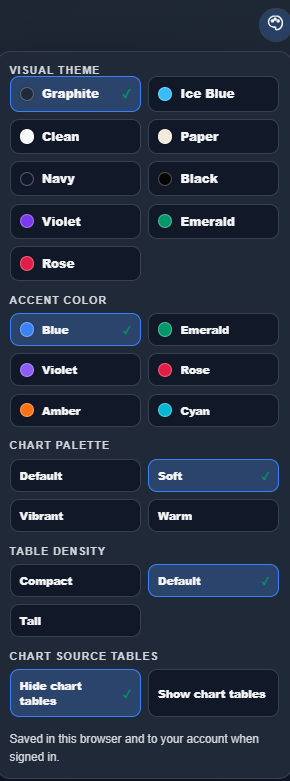
- Multiple visual themes, accent colors and chart palettes
- Compact, default and tall table-density choices
- Display-currency switching without changing portfolio inputs
- Chart source tables hidden by default but available for transparency
- Responsive desktop, tablet and phone layouts
Screenshots
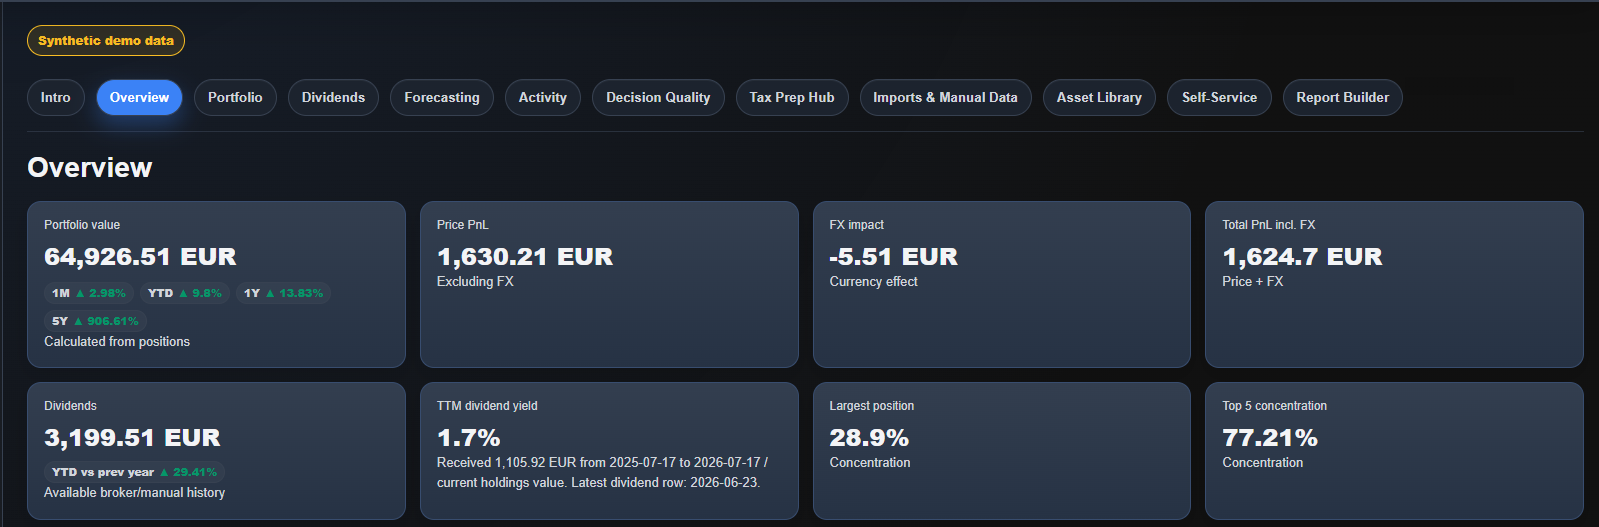
Overview dashboard
A compact view of portfolio value, price PnL, FX impact, dividends, yield and concentration using synthetic demo data.
Product updates
Recent improvements and feature highlights.
July 2026 hosted-app update
Added and improved
- More reliable portfolio updates and clearer status messages
- Improved price freshness, asset details, currency conversion and dividend coverage
- Next-12-month dividend calendar with announced events kept separate from history-based estimates
- Improved imports, manual-only portfolio setup and a clearer Asset Library
- Historical valuation and linked-return estimates with clearer coverage and calculation notes
- Allocation drift, custom benchmarks, saved self-service charts and a focused Report Builder
- More visual themes, responsive phone/tablet layouts and stronger account/security controls
v0.1.2 Alpha - May 2026
Added
- Tax Prep Hub for organizing tax-relevant portfolio activity
- Tax summary cards for dividends, withholding tax, realized activity and review-required items
- Tax readiness/data-quality checks and accountant questions
- Copyable prompt generator for accountant/LLM review
- Single Excel Tax Prep Workbook export
v0.1.1 Alpha - May 2026
Added
- Self-Service chart setup improvements
v0.1.0 Alpha - May 2026
Added
- Initial browser-based portfolio analytics dashboard
- Trading212 beta API support
- Manual transactions and positions input
- Portfolio overview, dividends, cashflows, PnL and benchmark analytics
Community
Join the community for feedback, bug reports, setup questions and feature ideas.
When reporting an issue, mention the tab, what you clicked, and attach a screenshot if useful. Do not share API keys or private full exports publicly.
Buy me a coffee
If you found value using the tool, a coffee helps keep it going. Support is optional and helps cover hosting, maintenance costs, testing, packaging and future development.

BTC Lightning / Wallet of Satoshi